Best time to stream GTA? 21:00 UTC — off-peak doesn't pay
12 min read
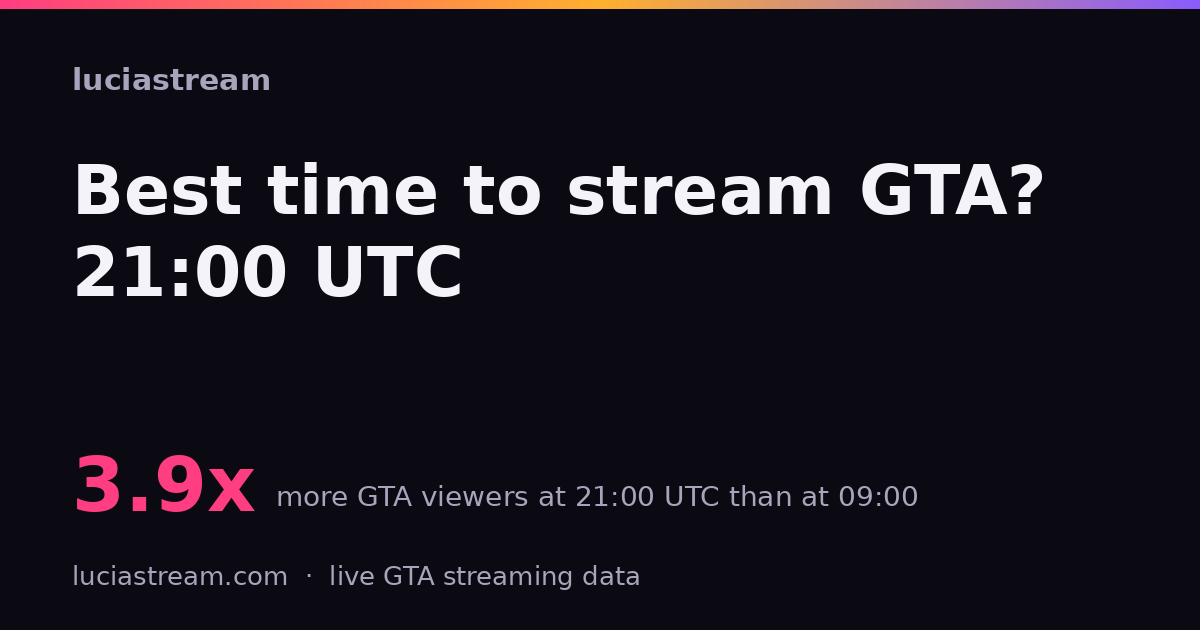
21:00 UTC.
Averaged over 229 hourly samples between 29 July and 8 August 2026, that hour held 399,948 people watching Grand Theft Auto live across Kick, Twitch and YouTube. The worst hour of the day, 09:00 UTC, held 102,426. The audience for this game is nearly four times bigger at one end of the clock than the other.
That is an average across nine full days, and the average hides something worth knowing: the shape is far more reliable than the size. On every one of those nine days the trough landed between 08:00 and 10:00 UTC, and on seven of nine the peak landed between 20:00 and 22:00 — the two that missed peaked at 00:00 and 02:00, still inside the same evening block. What varies is the depth. The gap between a day’s best hour and its worst ran from 2.8× on 1 August to 10.3× on 30 July. So you can rely on when the audience shows up. You cannot rely on how much of it turns up.
That is the easy half of the answer, and every “best time to stream” article on the internet stops there. The half that actually matters is the one nobody checks: does streaming into the quiet hours buy you a bigger share of a smaller audience?
It does not. That is the finding, and it is the opposite of the advice usually given to small channels.
The competition thins, but not fast enough
The obvious counter to “stream at peak” is that everyone else streams at peak too. Go live at 09:00 UTC and you are one of two thousand channels instead of one of four and a half thousand. On paper that is a better ratio.
Both curves do move. Over the twenty-four hours to 04:00 UTC on 8 August, the number of live GTA channels ran from 2,077 at 09:00 to 4,621 at 20:00 — a 2.2× swing. But the audience over the same clock swings 3.9×. Demand falls faster than supply, so the quiet hours are not a discount. They are just quiet.
Divide one by the other and you get mean viewers per live channel, which is the closest thing we have to a measure of how much attention there is to go around:
| Hour (UTC) | Mean viewers | Channels live | Viewers per channel |
|---|---|---|---|
| 00:00 | 319,551 | 4,379 | 68.3 |
| 01:00 | 331,917 | 4,396 | 72.0 |
| 02:00 | 304,394 | 4,327 | 62.8 |
| 03:00 | 270,117 | 4,150 | 55.9 |
| 04:00 | 224,787 | 3,564 | 60.9 |
| 05:00 | 192,848 | 3,103 | 68.1 |
| 06:00 | 154,373 | 2,666 | 61.8 |
| 07:00 | 120,623 | 2,353 | 54.9 |
| 08:00 | 108,825 | 2,167 | 42.0 |
| 09:00 | 102,426 | 2,077 | 33.2 |
| 10:00 | 110,559 | 2,116 | 41.6 |
| 11:00 | 135,490 | 2,278 | 55.9 |
| 12:00 | 158,110 | 2,638 | 62.1 |
| 13:00 | 190,948 | 3,025 | 62.5 |
| 14:00 | 226,442 | 3,350 | 62.8 |
| 15:00 | 249,138 | 3,585 | 64.4 |
| 16:00 | 277,940 | 3,828 | 65.4 |
| 17:00 | 292,884 | 3,988 | 82.2 |
| 18:00 | 296,524 | 4,208 | 81.1 |
| 19:00 | 319,750 | 4,516 | 75.9 |
| 20:00 | 364,489 | 4,621 | 83.4 |
| 21:00 | 399,948 | 4,524 | 93.9 |
| 22:00 | 385,319 | 4,454 | 89.1 |
| 23:00 | 359,792 | 4,383 | 79.4 |
The two right-hand columns come from a single day and the viewers column from nine and a half, so read the ratio as a shape rather than a constant. The shape is unambiguous: the best hour on raw audience is also the best hour per channel, and the worst is also the worst. 09:00 UTC is the trough on both measures at once — a third of the viewers of 21:00, and a third of the attention per channel. There is no hidden bargain hour.
Where the real windows are
Ranked by viewers per channel, the top seven hours are 21:00, 22:00, 20:00, 17:00, 18:00, 23:00 and 19:00 — an unbroken block from 17:00 to 23:00 UTC, with midnight to 02:00 not far behind. The bottom three are 09:00, 10:00 and 08:00. So the practical version of the answer is a window, not an hour: 17:00 to 02:00 UTC is the market, and 07:00 to 11:00 UTC is the dead zone.
One hour breaks the pattern and is worth knowing about. 05:00 UTC scores 68.1 viewers per channel, which beats both 15:00 and 16:00 while carrying a quarter to a third fewer viewers than either. By 05:00 the European and American channel count has collapsed but Kick’s Portuguese- and Arabic-speaking audience is still up, so demand holds while supply does not. It is the one genuine off-peak window in the day, and it exists because of who is awake, not because of a gap in the schedule.
Converted off UTC, 21:00 lands here:
| City | Local time at 21:00 UTC |
|---|---|
| Los Angeles | 14:00 |
| New York | 17:00 |
| São Paulo | 18:00 |
| London | 22:00 |
| Berlin, Madrid | 23:00 |
| Riyadh | 00:00 (next day) |
| Delhi | 02:30 (next day) |
| Bangkok | 04:00 (next day) |
Which is the first sign that “the best hour” is doing a lot of work in one sentence. 21:00 UTC is late afternoon in the Americas and the middle of the night across Asia. It is the peak of the global GTA audience, and the global audience is not who watches you.
YouTube runs on a different clock entirely
This is the part that surprised us. Split the same twenty-four hours by platform and the three curves do not line up.
| Hour (UTC) | Kick | Twitch | YouTube | YouTube share |
|---|---|---|---|---|
| 04:00 | 157,802 | 42,405 | 16,838 | 7.8% |
| 07:00 | 71,156 | 24,158 | 33,969 | 26.3% |
| 09:00 | 41,201 | 20,438 | 7,240 | 10.5% |
| 11:00 | 50,626 | 44,005 | 32,660 | 25.7% |
| 18:00 | 197,014 | 95,512 | 48,746 | 14.3% |
| 21:00 | 266,968 | 148,754 | 9,258 | 2.2% |
| 23:00 | 228,030 | 115,218 | 4,887 | 1.4% |
Kick and Twitch both peak at 21:00 UTC and both bottom out at 09:00 — a 6.5× and 7.3× swing respectively, moving more or less together. YouTube does neither: it peaks at 18:00 and bottoms out at 23:00, so its best hour arrives three hours before everyone else’s and its worst hour arrives two hours after their best. Its share of all GTA viewing runs from 1.4% at 23:00 to 26.3% at 07:00 — an eighteen-fold swing in relevance across the day. At 07:00 UTC, one of the four quietest hours on the board, better than one in four people watching GTA anywhere is watching it on YouTube.
Treat that one carefully. Only 150 of the 4,022 channels in this morning’s census were on YouTube, so a single large broadcast moves the platform’s whole line in a way it cannot move Twitch’s. The direction of the effect is consistent across the day; the exact percentages are not the kind of number to quote to three significant figures.
What this does not show
Quite a lot, and it is worth being specific about which parts.
Viewers per channel is a mean, and the mean is not you. A handful of Kick channels carry six-figure audiences, and they drag this ratio upward at every hour. In a census on 5 August the median live GTA channel held three concurrent viewers while the mean was 81. The column above measures how much attention exists per channel in the market, not what a given channel should expect to receive.
The competition curve is one day. Our hourly viewer history now covers 9.54 days, which is enough to average out a single odd evening. Live channel counts at hourly resolution only go back twenty-four hours, and those twenty-four hours were a Friday running into a Saturday. Weekday and weekend almost certainly differ, and we cannot yet say by how much. Given that the audience’s own peak-to-trough ratio ranged from 2.8× to 10.3× across the nine days we can see, treat 93.9 and 33.2 as the ends of one particular day rather than fixed constants — the ordering is the durable part, not the values.
This is availability, not causation. We can see when people are watching. We cannot see what would have happened to a specific channel had it moved slots, because we do not run that experiment — nobody does. A big audience in an hour is a necessary condition for finding viewers in it, not a sufficient one, and none of this speaks to how a platform’s recommendation system treats a new channel going live at an unusual time.
Your audience is not the global audience. English is the largest language on our board but nothing like a majority, and the Portuguese, Spanish and Arabic language boards each peak on their own clock. If you stream in Portuguese, the curve above is mostly telling you about a room you are not in. The 05:00 UTC anomaly is exactly this effect showing through the aggregate.
Channel discovery is still widening. We are finding more GTA channels week over week, so absolute channel counts drift upward for reasons that have nothing to do with more people going live. That matters for period-over-period comparisons; within a single day, which is what the ratio column uses, it is not a problem.
So: when should you go live?
If you want the largest possible pool of people who are demonstrably willing to watch GTA right now, 17:00–02:00 UTC, and 21:00 UTC above all. If you are in Europe or the Americas that is a normal evening slot, which is unglamorous advice, but it is what the measurements say and the widely repeated alternative — go live when it is quiet and get discovered — is not supported by anything in this data. The quiet hours are quiet on both sides of the ledger.
The one hour worth arguing about is 05:00 UTC, and only if you are streaming to an audience that is awake then. You can watch the same numbers move in real time on our live dashboard, and the leaderboard shows which channels are actually holding the audience at whichever hour you happen to read this.
Citing this. Permalink:
https://luciastream.com/blog/best-time-to-stream-gta/. Hourly viewer means
come from 229 hourly samples spanning 15:00 UTC on 29 July to 04:00 UTC on
8 August 2026 (9.54 days, 9 or 10 observations per hour of the day); the
per-day peak and trough figures use the nine complete UTC days in that span,
30 July to 7 August inclusive. Live
channel counts, the viewers-per-channel column and the platform split come from
five-minute samples across the twenty-four hours ending 04:00 UTC on 8 August
2026. The census figures are from 04:05:27 UTC on 8 August 2026: 4,022
live GTA channels holding 197,425 viewers, of which 321 channels and 135,263
viewers were on Kick, 3,551 and 56,026 on Twitch, and 150 and 6,136 on YouTube.
Collection method, known gaps and classifier limits are documented at
/methodology/.
Numbers in this post come from our own sampling — seehow we measure.