Does streaming more hours get you more viewers?
9 min read
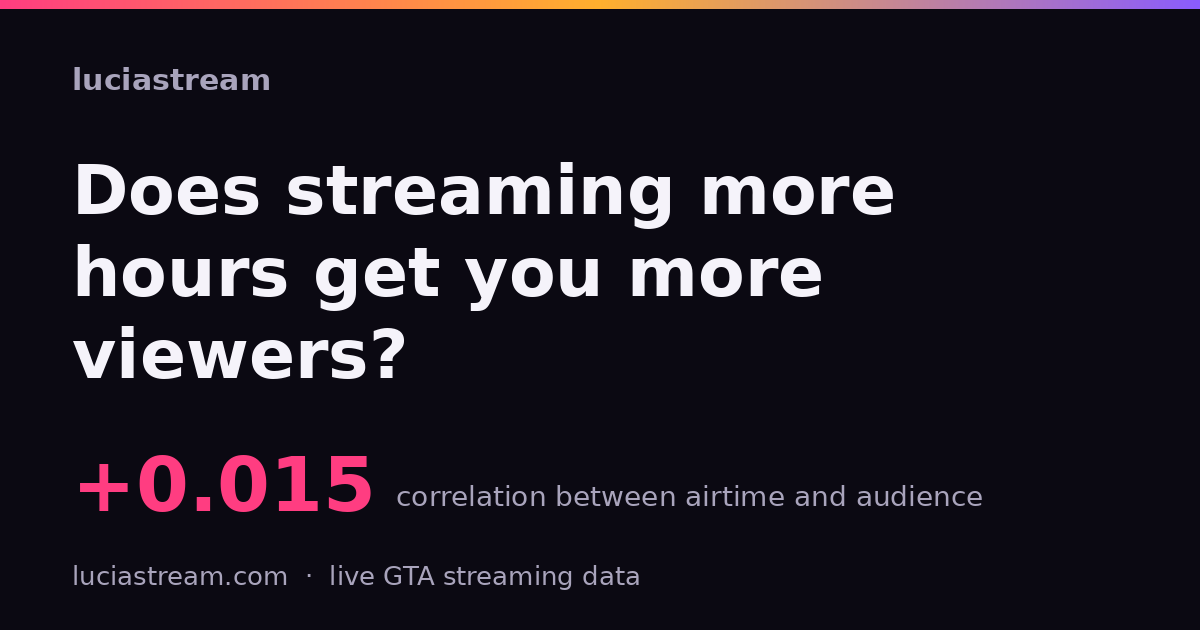
No. Not in our data, anyway — and among the channels that stream GTA seriously, the relationship runs gently the other way.
Across the 100 most-watched Grand Theft Auto channels on Kick, Twitch and YouTube, the correlation between hours streamed and average concurrent audience is +0.015. That is not a weak relationship. That is no relationship at all, to three decimal places. (Pearson on the raw values gives −0.13, which is the same answer with a different sign of noise.) Restrict it to the 68 channels that put in at least five hours of GTA in the window — dropping the celebrity drop-ins whose airtime is a rounding error — and it turns negative, to −0.22. Tighten it again to the 36 channels with twenty hours or more and it reaches −0.35.
The single most-watched GTA channel in the window streamed 18 hours of it. The hardest-working channel on the board streamed 156.9 hours — nearly nine times as much — for 8,665 average viewers against the leader’s 112,581.
Before anyone quits their schedule over this: that comparison is doing something dishonest, and most of this piece is about what.
What we measured
Every minute, our collector samples every live GTA stream on the three platforms. From that we roll up, per channel, two things that matter here: airtime, the wall-clock hours that channel spent streaming GTA, and average concurrent viewers, weighted by airtime — so a channel that spikes to 40,000 for six minutes does not outrank one that holds 12,000 all month.
The board below is the top 100 by that weighted average, over a 30-day rollup window, read at 03:53 UTC on 24 August 2026. Continuous collection began at the end of July, so the window currently spans about 25 days rather than a full 30.
Splitting those 68 channels into four equal groups by airtime gives the shape more plainly than a correlation coefficient does.
| GTA airtime in the window | channels | median airtime | median avg. viewers |
|---|---|---|---|
| 5.0 – 8.0 h | 17 | 6.8 h | 9,849 |
| 8.0 – 22.9 h | 17 | 15.1 h | 12,798 |
| 23.5 – 60.9 h | 17 | 44.2 h | 10,677 |
| 63.6 – 156.9 h | 17 | 111.3 h | 7,296 |
The group streaming the most GTA has the smallest median audience, and it is not close: 7,296 against 12,798 for the group streaming a seventh as much. If hours bought audience, this table would climb. It peaks in the second quartile and then falls away.
Why this is not the advice it looks like
Here is the honest version, and it is more interesting than “stop streaming”.
The two ends of that chart are different kinds of channel. Our airtime figure counts GTA hours only. A variety streamer who is live forty hours a week and spends three of them in Los Santos appears here as a three-hour channel. KaiCenat shows up on this board with 2.6 hours and 55,338 average viewers; he is not a part-time streamer, he is a full-time streamer who played some GTA. Meanwhile the far right of the chart — lazenxd at 156.9 hours, 3mr at 154.0, GTASeriesVideos at 145.2 — is where the GTA specialists live, people for whom this game is the whole channel.
So the negative correlation is mostly composition, not consequence. Large general audiences arrive attached to a person and follow them into whatever they launch; large GTA-specific audiences have to be built inside one game’s directory, against everyone else in it. Those are two different businesses with two different ceilings, and the second one is harder. Reading this table as “streaming less will grow your channel” gets it exactly backwards.
What the data does kill is a narrower and very common claim: that the people at the top of a game’s rankings got there by out-houring everyone else. On this board they demonstrably did not. Whatever separates the leader from the channel in fiftieth place, it is not time logged — that variable is spent, and it explains nothing.
What hours actually buy
They buy the other number, and they buy it almost perfectly.
Rank the same 100 channels by total hours watched — audience multiplied by airtime, the figure that drives ad impressions, subscriptions and every payout formula either platform runs — and the correlation with airtime is +0.91. Among the 68 serious streamers it is +0.78. Airtime is close to a linear lever on total watch time even as it does nothing for concurrent audience.
That is the real trade, and nobody frames it this way. Between them, those 100 channels streamed 3,041 hours of GTA in the window and were watched for 36.6 million.
| Channel | Platform | GTA airtime | Avg. viewers | Hours watched |
|---|---|---|---|---|
| drb7h | Kick | 18.0 h | 112,581 | 2,030,221 |
| sxb | Kick | 26.2 h | 90,999 | 2,382,670 |
| absi | Kick | 68.0 h | 37,391 | 2,542,011 |
| 3mr | Kick | 154.0 h | 14,708 | 2,265,128 |
| KaiCenat | Twitch | 2.6 h | 55,338 | 142,957 |
| lazenxd | Kick | 156.9 h | 8,665 | 1,359,557 |
Read that top to bottom. drb7h has the largest audience on the board and is fourth by hours watched. absi, with a third of drb7h’s audience, is first — because absi streamed nearly four times as long. And 3mr, whose concurrent audience is 13% of drb7h’s, does not merely close the gap on 154 hours but overtakes it: 2.27 million hours watched against 2.03 million. Airtime is how a mid-sized channel out-earns a much larger one. It is not how it becomes one.
What this does not show
Quite a lot, and it is worth being explicit.
It is a survivorship sample. Every channel here already made the top 100, so this describes what varies among the successful. It says nothing about the streamer at 40 viewers deciding between three nights a week and six, which is the question most people arrive with — and we cannot answer that one from this board, because the board does not contain them. A proper test needs the whole population, including everyone whose hours bought nothing, and that comparison is the one we have not run.
Nor can we see total airtime, only GTA airtime, which is the confound the whole middle section is about. We cannot see consistency — the same 40 hours as five predictable evenings or one chaotic weekend are identical in this data, and the folklore says they are not. And a 25-day window catches one Twitch Drops campaign, one pre-launch news cycle, and whatever the algorithm was doing this month.
What we would need to answer the real question is session-level history across the full population, tracking channels from before they were anyone. We are collecting it. Ask again in six months.
Cite this
The figures above come from luciastream’s own minute-resolution collector, sampling every live GTA stream on Kick, Twitch and YouTube. The window is the 30-day creator rollup read at 03:53 UTC on 24 August 2026, covering the 100 most-watched GTA channels; correlations are Spearman rank coefficients except where Pearson is named. For scale, live totals across the same three platforms were 268,418 viewers across 1,982 channels at 04:00 UTC and 217,469 across 1,907 at 04:13 — a 19% swing in thirteen minutes, almost all of it Kick, which is its own argument for quoting a 30-day rollup rather than an instant.
Permalink: https://luciastream.com/blog/does-streaming-more-hours-get-more-viewers/.
The current board is at /leaderboard/,
the live figures at /live/, and how any of it is
measured at /methodology/. If you want
the underlying numbers to check this yourself, they are public JSON and the
methodology page says where.
Numbers in this post come from our own sampling — seehow we measure.