Do a few channels get all the GTA viewers?
7 min readUpdated 17 October 2026
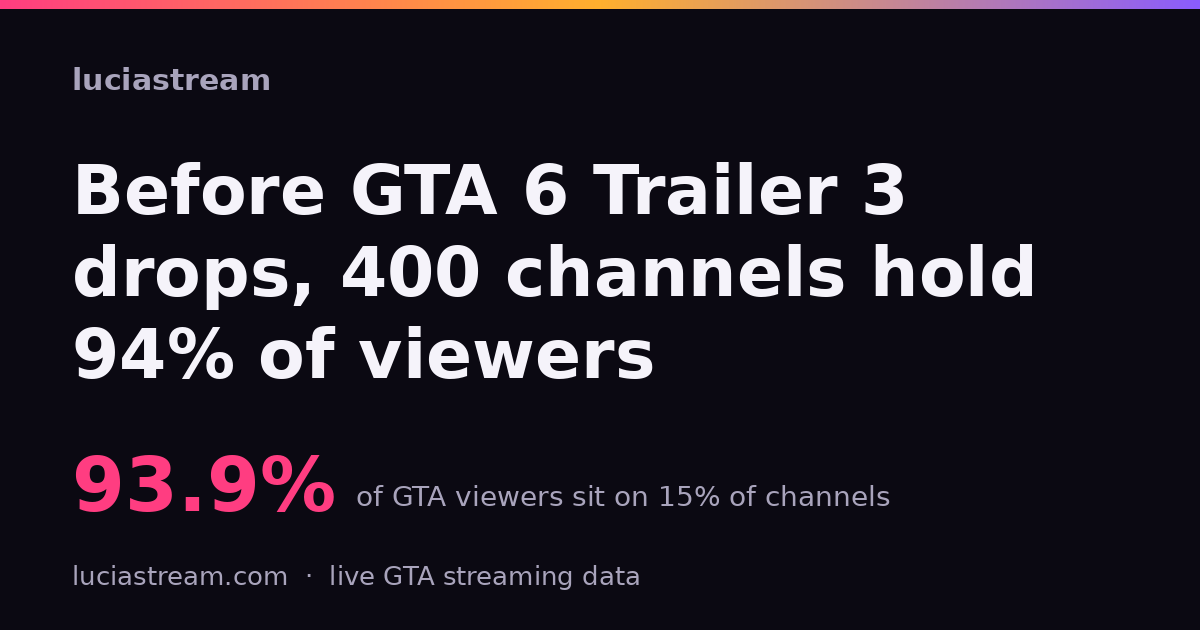
Correction and rewrite, 10 October 2026. This page was published on 31 July 2026 under the headline “Before GTA 6 Trailer 3 drops, 400 channels hold 94% of viewers”, and two things about it were wrong.
There is no Trailer 3. Rockstar has never released or announced a video by that name. Checked again on 10 October against the official GTA VI site: it lists Trailer 1, Trailer 2 and An Extended Look — the 27 August 2026 video — and the string “Trailer 3” appears on it zero times. (Re-checked 17 October, after Rockstar published the GTA VI Launch Trailer on 15 October 2026: the page lists that video too, and “Trailer 3” still appears zero times.) The original post treated a fan-expected trailer as imminent. If you came here for that question, we answer it properly and with dates at when is the next GTA 6 trailer; this page no longer tries to.
And “400 channels hold 94%” was not a measurement of concentration. Four hundred is the length of our own ranked board, not a feature of the audience. The section below shows exactly how that number misleads, using the same figure measured ten weeks later. The honest statistics are underneath it, and they now come from the full live population rather than the board alone.
Everything that follows was re-measured on 10 October 2026. The 31 July figures are kept, labelled, because the comparison is the point.
Yes, and severely. At 04:10:40 UTC on 10 October 2026 there were 231,390 people watching 2,072 live Grand Theft Auto channels across Kick, Twitch and YouTube. Ten of those channels held 39.2% of everyone. The single largest held 9.7% on its own. The median channel had seven viewers.
More than half of everyone broadcasting — 1,194 channels, 57.6% of them — had fewer than ten people watching, and between them they held 1.8% of the audience. That is the shape of the thing: a scene where the typical participant is almost alone and the top of the curve is enormous.
The honest numbers
A concentration claim has to be measured on the whole population, and it has to use statistics that do not change meaning when the population changes size. These do. Both columns are full-population censuses — the ranked board concatenated with its tail — taken two minutes apart and reconciling exactly to the platform totals.
| Measure | 04:10:40 UTC | 04:12:41 UTC |
|---|---|---|
| Live channels | 2,072 | 2,050 |
| Live viewers | 231,390 | 235,017 |
| Largest single channel’s share | 9.67% | 9.66% |
| Top 10 channels’ share | 39.23% | 39.32% |
| Top 10% of channels’ share | 87.47% | 87.76% |
| Gini coefficient | 0.907 | 0.908 |
| Median channel | 7 | 6 |
| Mean channel | 112 | 115 |
| Channels under 10 viewers | 57.63% | 57.71% |
| …holding between them | 1.84% | 1.79% |
A Gini of 0.907 is the number to keep. Income inequality in the most unequal country on earth sits near 0.63; this is a distribution far past anything an economy produces, and it is normal for attention markets. The top decile taking 87.5% says the same thing in plainer language.
Why the original headline was wrong
Our live board publishes the top 400 streams and the rest sit in a companion file. On 31 July we had only the board, so “the top 400” was mistaken for a natural segment of the audience. It is not. It is a cut at a fixed rank, and the share above a fixed rank moves with the size of the population underneath it.
Here is the proof, and it is unusually clean:
| 31 July 2026, 16:03 UTC | 10 October 2026, 04:10 UTC | |
|---|---|---|
| Live channels | 2,668 | 2,072 |
| Top 400’s share of viewers | 93.9% | 94.13% |
| Top 400 as a share of channels | 15.0% | 19.3% |
| Largest channel’s share | 13.0% | 9.67% |
The headline figure moved 0.2 points in ten weeks. Over the same stretch the channel population fell 22.3%, so those same 400 channels went from being the top 15.0% of the scene to the top 19.3% of it. A statistic that holds steady while the thing it describes changes by a fifth is not measuring that thing. It was pinned in place by the board’s length.
This is a structural point rather than a trend: the two readings are ten weeks and twelve hours of clock apart, and the GTA audience rotates hard through the day as time zones wake. Treat the two columns as two framings of the same measurement, not as a time series. What the comparison establishes is that the original number was an artefact of our instrument — which does not need a matched hour to be true.
Kick and Twitch are not concentrated the same way
The original post made a claim it liked a lot: every Kick GTA channel was large enough to rank in the global top 400 — all 154 of them. That was true in July and it is comprehensively not true now. Kick has 406 live GTA channels, and 248 of them (61.1%) make the board.
Per-platform concentration, measured within each platform so the comparison does not reward whichever platform happens to be smaller:
| Platform | Live channels | Median channel | Gini | Under 10 viewers |
|---|---|---|---|---|
| Kick | 406 | 72 | 0.811 | 15.8% |
| Twitch | 1,602 | 5 | 0.904 | 68.4% |
| YouTube | 64 | 7 | 0.933 | 53.1% |
The median live GTA channel on Kick has 72 viewers; on Twitch it has five. That gap is the most practically useful number on this page, and it is not a concentration finding so much as a crowding one — Twitch carries four times Kick’s GTA channel count for two-thirds of Kick’s GTA audience. We have written up what that means for choosing a platform in Kick or Twitch: which gets more viewers.
What actually changed underneath
On the two concentration figures both dates can support, very little: the top fifteen channels held 44.5% in July and 45.67% now, and the largest single channel’s share actually fell, from 13.0% to 9.67%. The composition moved enormously, and the original post’s second-biggest claim has inverted.
| Content type | 31 July 2026 | 10 October 2026 |
|---|---|---|
| Freeroam | 71.8% | 49.30% |
| Roleplay | 19.2% | 45.77% |
In July, freeroam was “nearly four times the audience of roleplay” — the original wording. It is now 1.08×, and roleplay has gone from a fifth of GTA viewing to within five points of half of it. The cause is dated and documented: nopixel V relaunched on 8 September 2026 as an invite-only closed beta with Rockstar’s backing. We tracked that reversal in detail, including the parts that argue against reading it as permanent, in is GTA RP dying.
What this does not show
One hour, on one Saturday morning, at an hour of the clock that flatters some regions and buries others. The two censuses two minutes apart agree to within 0.001 on the Gini, but that is a measurement-stability check and nothing more — it says the instrument is steady, not that the statistic holds at 18:00. We do not know how concentration moves through the day, because there is no concentration or content-type series anywhere in our published data, only matched-hour readings we take by hand. That is also why the 31 July comparison above is two points and not a line.
Content type is inferred from titles, tags and category metadata, and the boundary between freeroam and GTA Online is genuinely fuzzy. The classifier also still files some title-obvious roleplay as freeroam, so the roleplay share above is more likely understated than overstated. Our methodology page sets out how the tagging works.
And one thing the Gini cannot tell you: whether this is a bad distribution. A scene where ten channels hold 39% of attention is also a scene where 1,194 people streamed to fewer than ten viewers this morning and will do it again tomorrow. Whether that is a funnel or a dead end is not a question a concentration statistic answers, and anyone who tells you it does is selling something.
Cite this
Full-population census of every live Grand Theft Auto stream on Kick, Twitch
and YouTube at 04:10:40 UTC on 10 October 2026 (n = 2,072 channels, 231,390
viewers), cross-checked against a second census at 04:12:41 UTC (n = 2,050).
Permalink:
https://luciastream.com/blog/gta-6-trailer-3-audience-concentration/.
Historical column measured 16:03 UTC on 31 July 2026 (n = 2,668 channels,
264,439 viewers) and originally published from the ranked board alone. Sampling,
classification and the known limits of both are documented at
/methodology/, and the current figures are live on
the board and the leaderboard.
Numbers in this post come from our own sampling — seehow we measure.